3.5 GLOBAL VARIABLES, ANIMATIONS
![]()
INTRODUCTION |
|
Computer graphics are frequently used to represent time-varying content. For example, you can simulate a process from physics or biology, or create a computer game. We generally call such a program an animation. In order to show a temporal sequence, new images are drawn one after another, always after an equal step in time, called an animation step. |
CHANGING GLOBAL VARIABLES |
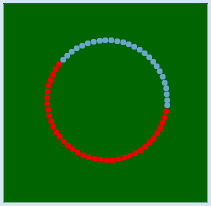
It is common to introduce an endless animation loop in the main program that repeatedly calls step(). By incorporating a delay, you can change the speed of the animation. When using step(), the global variable t should increase at each step and reset to 0 once it has reached 2P, and the color should change. import math from gpanel import * def step(): global t x = r * math.cos(t) y = r * math.sin(t) t = t + 0.1 if t > 6.28: t = 0 setColor(getRandomX11Color()) move(x, y) fillCircle(10) makeGPanel(-500, 500, -500, 500) bgColor("darkgreen") t = 0 r = 200 while True: step() delay(10) |
MEMO |
|
Python prohibits changing the value of global variables in functions. We can bypass this by providing the variable with the keyword global in the function. The identifier global poses risks: any function can not only change a variable designated as global, but can also create it, as the following example shows:def set(): global a a = 2 def get(): print "a =", a set() get() Since set() generates a variable a which is visible throughout the entire program, we also say that the function set() has side effects. Also note how nicely several things, one after another, can be written into the console using comma separation in a print statement. In the output the comma is replaced by a space. |
THE TRICK WITH THE EVEN TICK |
The animation loops should run in time ticks that are as even as possible, i.e. with the desired animation period, otherwise the movement will be jerky. With step() each new animation state is set up. Depending on the situation, this can take different amounts of time to complete, as the program may not always run the same parts of the code, and also because the computer may be busy with other tasks in the background, which may delay the execution of the Python code. To compensate for the step() of varying length, the following trick is used, which you could also have figured out yourself: before calling step(), you keep track of the current time using the variable startTime. After returning from step() you wait in a waiting loop until the difference between the new time and the start time reaches the animation period.
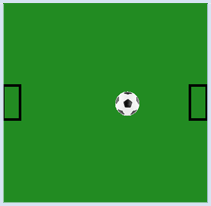
from gpanel import * import time def step(): global x global v clear() lineWidth(5) move(25, 300) rectangle(50, 100) move(575, 300) rectangle(50, 100) x = x + v image("_sprites/football.gif", x, 275) if x > 500 or x < 50: v = -v makeGPanel(0, 600, 0, 600) bgColor("forestgreen") enableRepaint(False) x = 300 v = 10 while True: startTime = time.clock() step() repaint() while (time.clock() - startTime) < 0.020: delay(1) |
MEMO |
Using time.clock() you can get the current time as a decimal number. The given value is dependent on the computer (processor time, or the time since the first call of clock()). But since you only need the time difference, it does not matter. Save the time before calling step() and wait at the end of the animation loop with a delay(1), until the difference between the current time and the start time reaches the animation period (in seconds). Remember this trick, for you will use it for many processes that ought to run as periodically as possible. Every graphics command is immediately visible in the GPanel window. Deleting with clear()while animating will briefly show an empty graphics window, which can lead to a flickering effect. To avoid this, double buffering should be used in animations. You can achieve this using the command enableRepaint(False), causing the graphics command to be executed only in a background buffer (off screen buffer) and effects are no longer visible. So clear() only deletes the background buffer and does not erase the graphics window anymore. You must trigger the display of the graphics buffers on the screen (called rendering) yourself at the right moment by calling repaint().In this program you also need to globally distinguish the variables x and v in the function step() since they are changed in the function. |
EXERCISES |
|